
|
Draft for Information Only
Content
MatLab: Scratch
Canvas &
Graphic
Operations
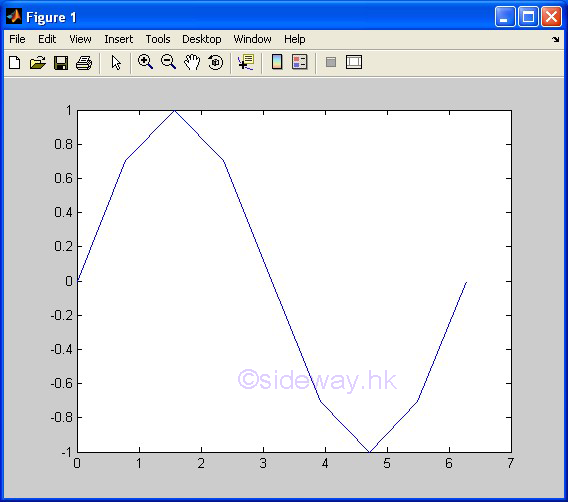
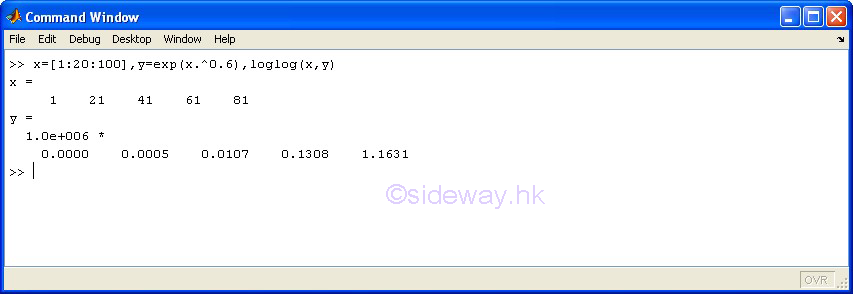
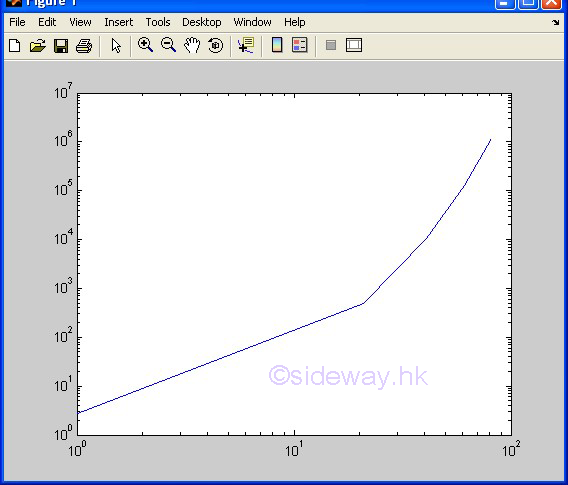
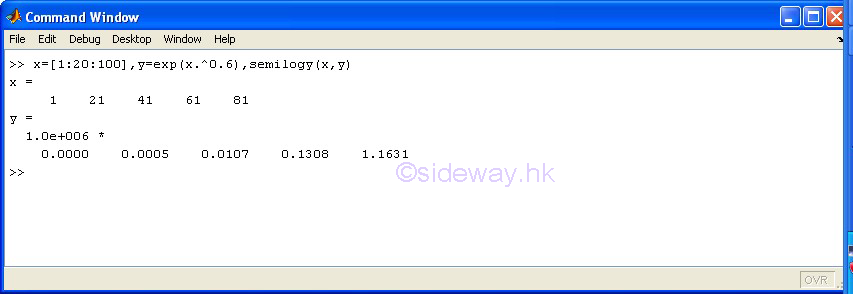
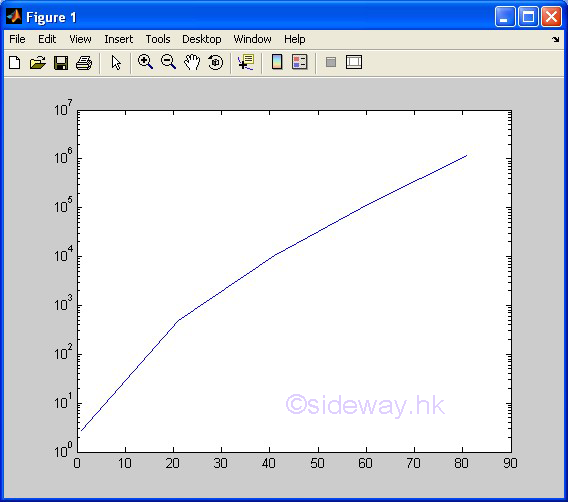
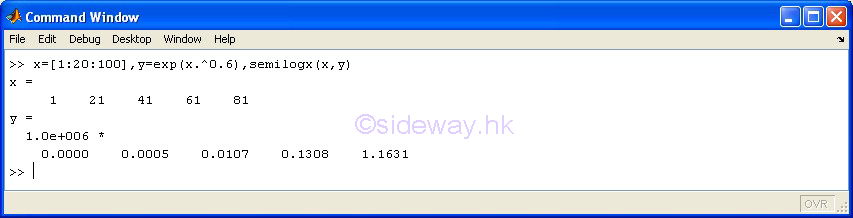
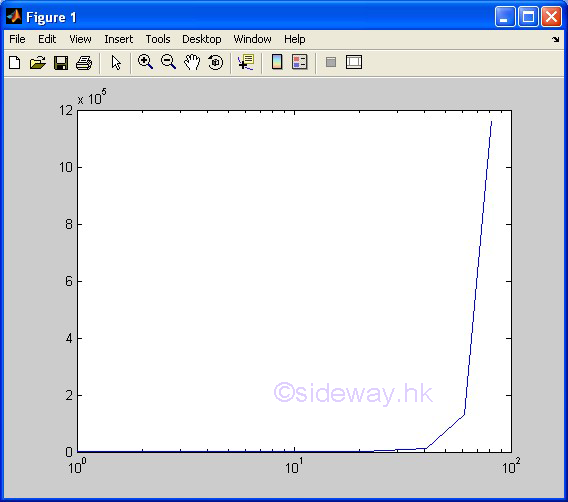
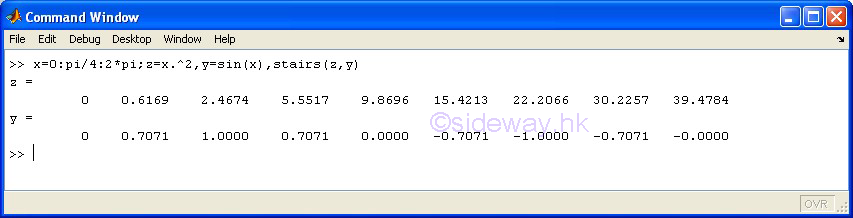
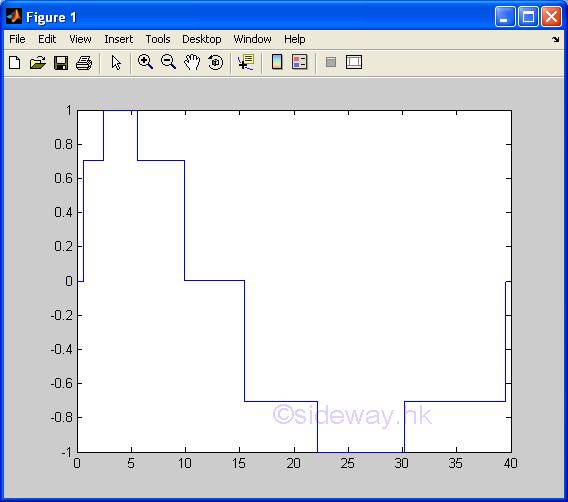
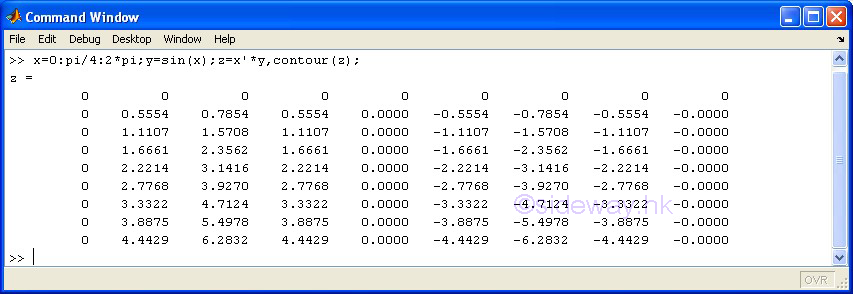
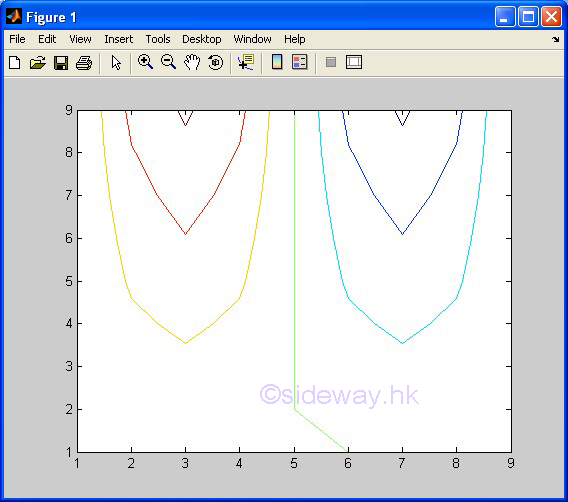
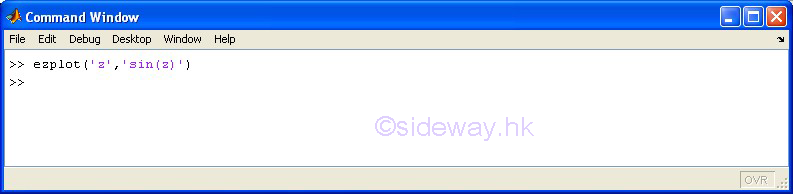
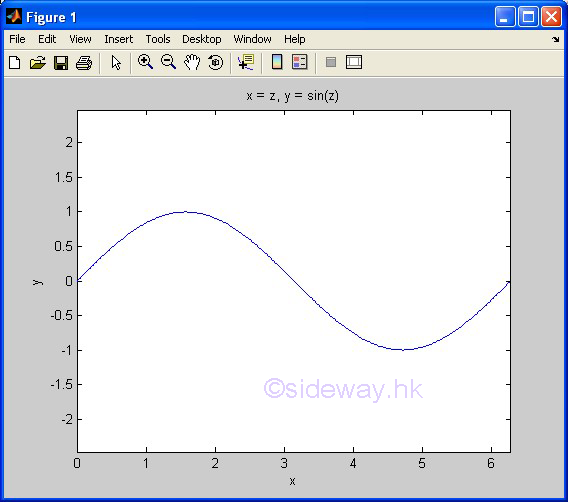
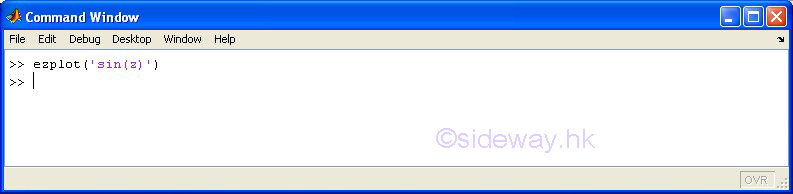
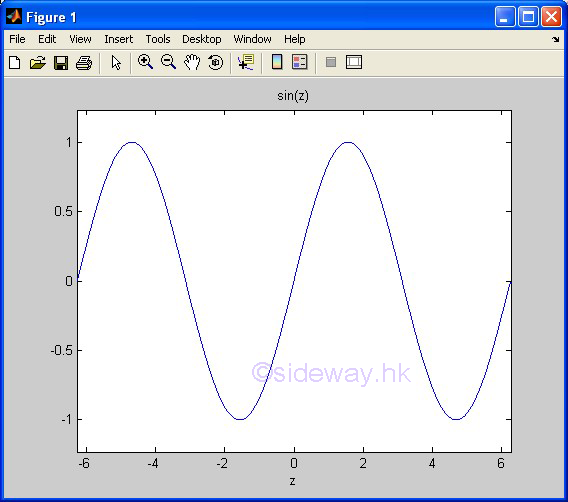
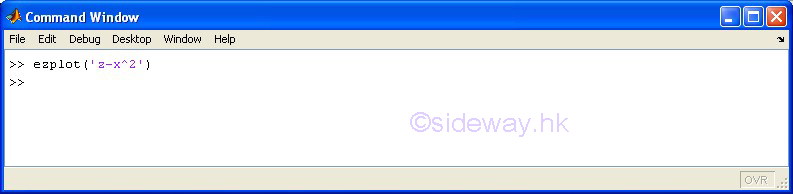
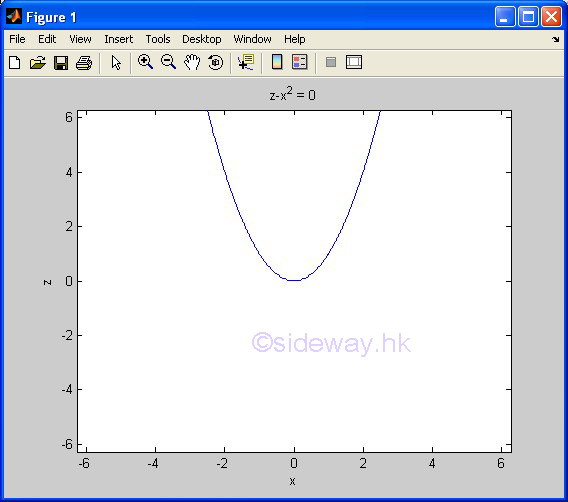
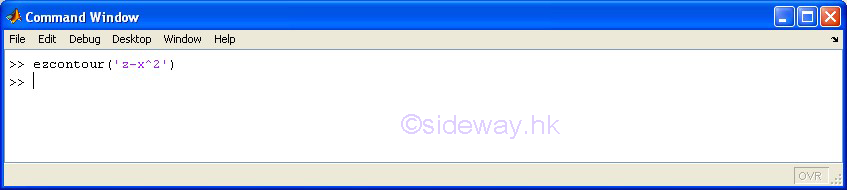
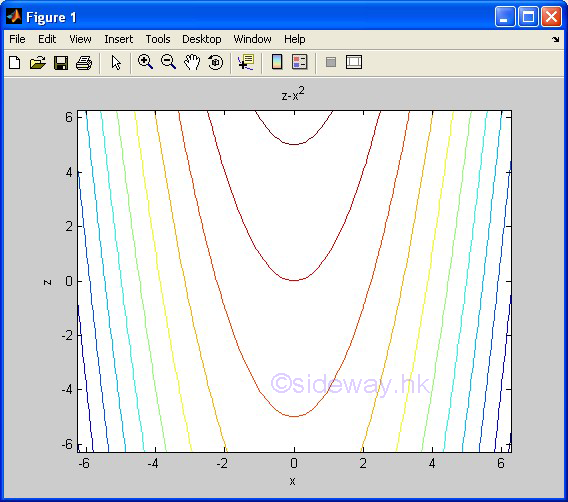
MatLab: Scratch Canvas & Graphic OperationsMajor Reference Source: MatLab Verson 7.0 Using MatLab package as a scratch canvas interactively is one of the common application of the MatLab package. MatLab commands are entered at the prompt command, >>, of the Command Window through the PC keyboard. Both entered commands and evaluation results are displayed in the Command Window. All new line or lines of commands or instructions after the prompt command will be passed to MatLab for evaluation after pressing the Enter key no matter the position of mouse cursor is at the end of line or lines or not. However, the MatLab package is design as a tool to manipulate data instead of a design tool to create some common features, therefore functions are usually some basic tools to present or display the provided data graphically in the scratch canvas as a figure. In other words, both the domain and range of the function are needed to be provided before a single graph of the function can be presented by a plotting function. As the plotting area is only be considered as a scratch canvas, multiple functions plotting on the same scratch canvas are allowed. Besides there are also addition tools for annotating and manipulating the figure in the scratch canvas. 2D PlotsThere are five types of 2D presentation, namely, Line Graph, Bar Graph, Area Graph, Direction Graph and Scatter Graph. These 2D presentations are characteristic by its form of presentation. Line GraphsThe presentation of plot is in the form of line, actually piecewise line. The matrix and array arithmetic includes seven types of operations:
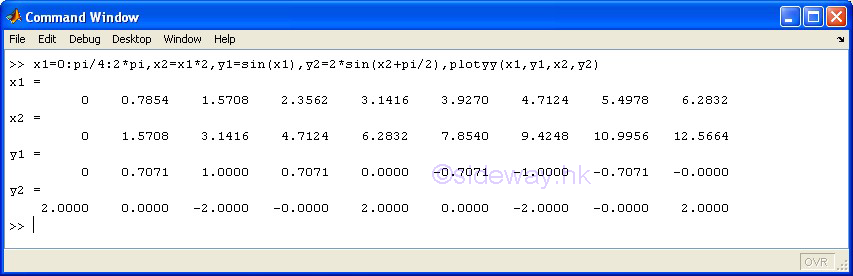
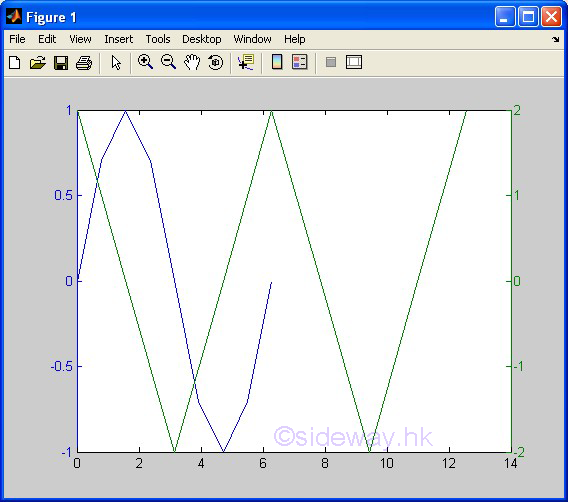
Examples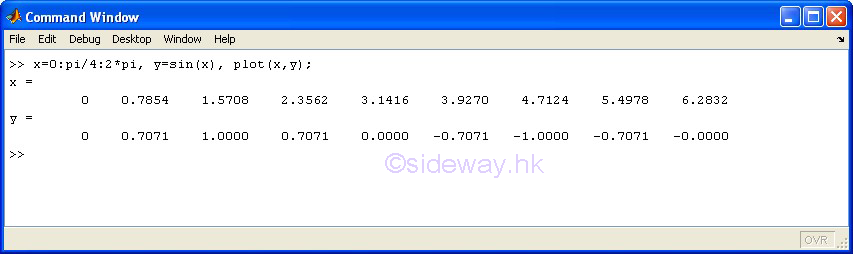
3D Plots
©sideway ID: 140600009 Last Updated: 6/19/2014 Revision: 0 Latest Updated Links
  Nu Html Checker Nu Html Checker  na na |
 Home 5 Business Management HBR 3 Information Recreation Hobbies 8 Culture Chinese 1097 English 339 Reference 79 Computer Hardware 249 Software Application 213 Digitization 32 Latex 52 Manim 205 KB 1 Numeric 19 Programming Web 289 Unicode 504 HTML 66 CSS 65 SVG 46 ASP.NET 270 OS 429 DeskTop 7 Python 72 Knowledge Mathematics Formulas 8 Algebra 84 Number Theory 206 Trigonometry 31 Geometry 34 Calculus 67 Engineering Tables 8 Mechanical Rigid Bodies Statics 92 Dynamics 37 Fluid 5 Control Acoustics 19 Natural Sciences Matter 1 Electric 27 Biology 1 |
Copyright © 2000-2024 Sideway . All rights reserved Disclaimers last modified on 06 September 2019